The Rental Investment Analyzer is a comprehensive financial analysis tool for evaluating Canadian rental properties. It converts user inputs (market rent, expenses, financing, etc.) into professional metrics like NOI, DSCR, cap rate, cash-on-cash return, and break-even rent. It supports common scenarios: new purchases or refinances, varying hold periods, and strategies (cash-flow-first vs. appreciation-first, BRRRR, stress-case). The manual below provides a step-by-step walkthrough of every input section, definitions of key metrics, investor profile interpretations (Conservative/Balanced/Aggressive), scoring rules for the Deal Scorecard, and example workflows. I include detailed examples (numeric tables), diagrams (Mermaid flowchart and timeline), and authoritative definitions (e.g. NOI, DSCR, cap rate, cash-on-cash).
Introduction & Supported Scenarios
Investor Profiles (Conservative, Balanced, Aggressive)
Deal Scorecard and KPI Metrics
Practical Tips & Common Mistakes
Key Highlights
- Use Cases: Purchase vs. refinance, short vs. long hold, BRRRR, stress testing scenarios.
- Step-by-Step Guide: Each input is explained (what it means, why it matters, how to estimate, with numeric examples).
- Investor Profiles: Defined as Conservative, Balanced (default), and Aggressive. We list exact thresholds for cash flow, DSCR, cash-on-cash, break-even rent ratio, and stress tolerance. We show three worked examples of one deal under each profile with resulting labels and grades.
- Deal Scorecard: Explains each KPI tile (Monthly Cash Flow, NOI, Cap Rate, DSCR, Cash-on-Cash, Break-even Rent) with formulas and interpretation, and the overall grade (A–D) based on scoring.
- Workflows: Step-by-step for common goals like quick screening, purchase underwriting, refinance planning, and BRRRR analysis.
- Tips & FAQ: Practical guidance, common pitfalls (e.g. ignoring reserves or vacancy), and quick Q&A.
The manual is formatted with tables and mermaid diagrams for clarity.
Introduction & Supported Scenarios
The Rental Investment Analyzer helps investors and realtors evaluate rental property deals by translating inputs into key financial ratios and projections. It covers scenarios including:
- New Purchase: Buying a property to hold as a rental.
- Refinance/Existing Property: Evaluating an existing rental being refinanced or repositioned.
- Short-Term Hold (e.g. 3–5 years) or Long-Term Hold (5–10+ years).
- BRRRR Strategy: (Buy-Rehab-Rent-Refinance-Repeat) planning for recycling equity.
- Cash-Flow-First vs. Appreciation-First: Prioritizing high cash flow or high growth.
- Stress Cases: Running “what-if” scenarios (e.g. rate jumps, rent drops).
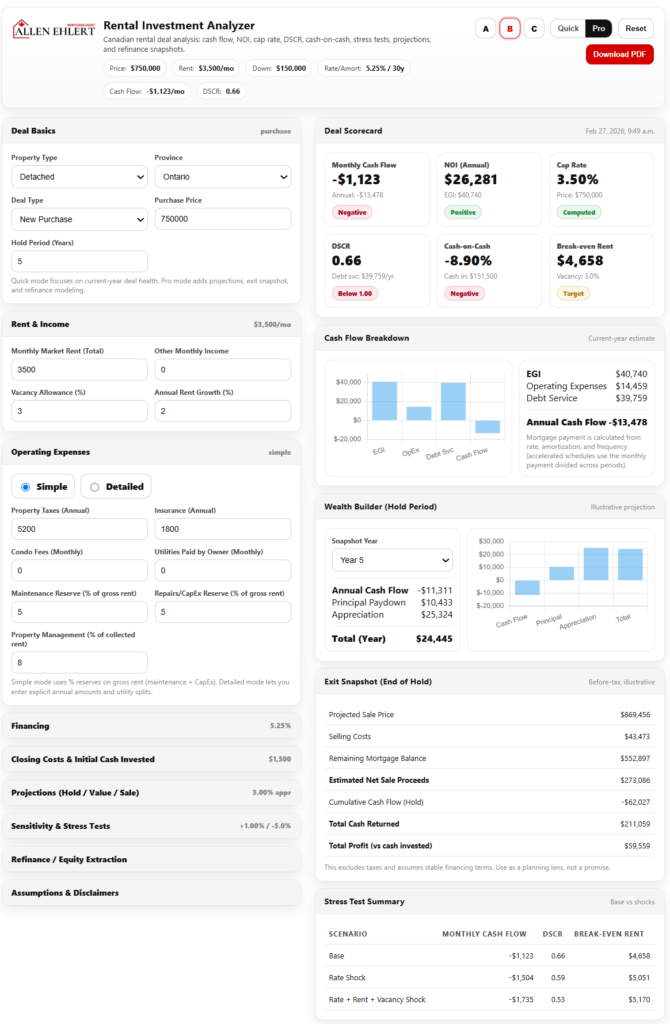
The tool’s input sections (Deal Basics, Rent & Income, Expenses, Financing, Closing Costs, Stress Tests, Projections, Refinance) correspond to typical underwriting steps. It then outputs a Deal Scorecard of metrics and grades, plus a downloadable PDF summary.
The diagram below shows the workflow from inputs through calculations to outputs:
flowchart LR
  subgraph Input Sections
    A(Deal Basics) --> B(Rent & Income)
    B --> C(Operating Expenses)
    C --> D(Financing)
    D --> E(Closing Costs)
    E --> F(Sensitivity & Stress Tests)
    F --> G(Projections & Exit)
    G --> H(Refinance)
  end
  A & B & C & D & E & F & G & H --> Calc[Computations]
  Calc --> Scorecard["Deal Scorecard & Metrics"]
  Scorecard --> PDF["Download PDF Summary"]
How to Complete Each Section
This section walks through every input field in order, explaining what it is, why it matters, and how to estimate it. Numeric examples are provided where helpful.
Deal Basics
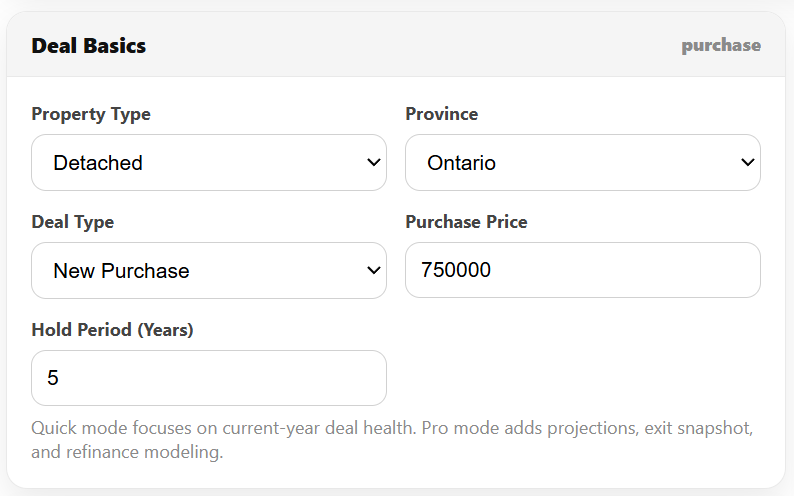
- Deal Context (Purchase vs. Refinance): Select “New Purchase” for a fresh buy, or “Refinance” for an existing property.
- Why it matters: Purchase uses the purchase price for calculations; refinance uses current value and existing mortgage balance.
- Purchase Price / Current Value: Enter the agreed purchase price (or current appraised value for refinance).
- Existing Mortgage Balance: (Refinance only) Enter the current mortgage balance.
- Hold Period (years): The intended time you plan to own before selling. Common ranges: 3–5 years (short hold) or 5–10+ years (long hold).
- Why it matters: Holds affect exit projections (sale price, remaining mortgage). Longer holds accentuate appreciation; short holds make selling costs more significant.
Example: Purchasing a $500,000 condo to hold for 5 years.
Rent & Income
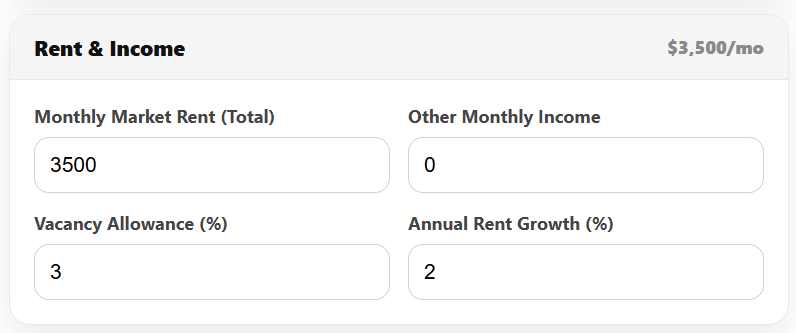
- Monthly Market Rent (Total): Total expected rent per month from the property.
- Why it matters: Primary revenue source. Use current market rates for similar units.
- Example: $2,000/month rent for a 2-bedroom condo.
- Other Monthly Income: Any additional rent (parking, laundry, storage) per month.
- Example: $50/month for laundry.
- Vacancy Allowance (%): Percent of gross potential income assumed unoccupied.
- Why it matters: Real-world rentals are never 100% occupied. Even a “great” rental can have turnover or voids.
- Typical values: 3–5% for stable urban markets; 5–8% for moderate turnover. Higher if tenant pools are weak.
- Effect: Vacancies reduce Effective Gross Income (EGI) = gross rent × (1 – vacancy%).
For example, $2,000 rent with 5% vacancy yields EGI = $2,000×12×0.95 = $22,800/year.
Operating Expenses
You can enter expenses in Simple or Detailed mode:
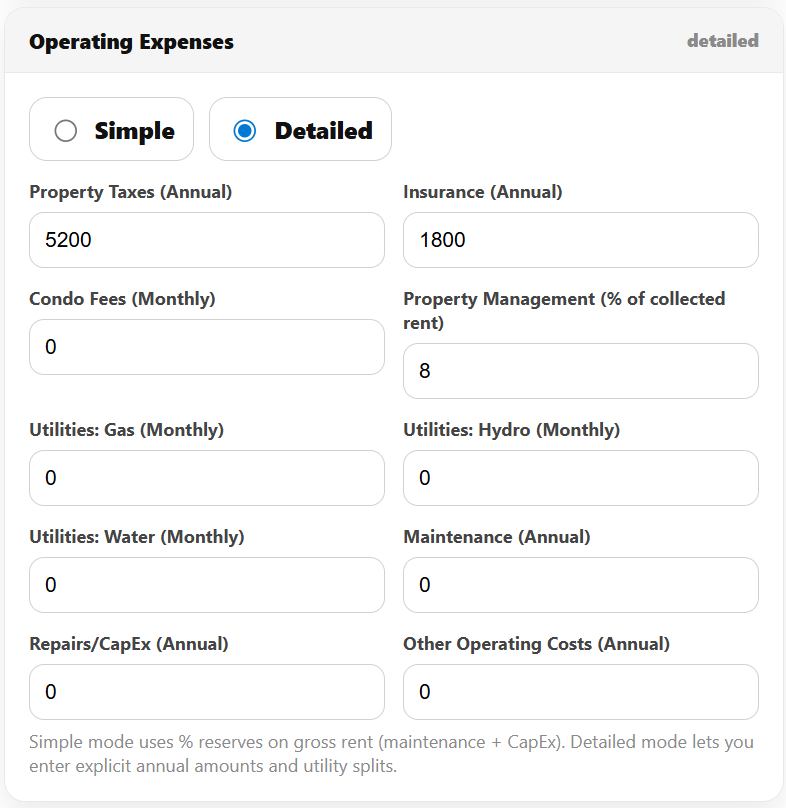
- Simple Mode: Enter key categories; the tool computes reserves as a % of gross rent.
- Property Taxes (annual). Municipal taxes. Use latest tax bill.
- Insurance (annual). Property insurance cost.
- Condo Fees (monthly). If condo, monthly maintenance fee.
- Utilities Paid by Owner (monthly, simple mode). Water, gas, hydro paid by you (owner).
- Property Management (% of rent). Typical full-service mgmt ranges 5–10% of collected rent. For a DIY landlord enter 0–5%.
- Maintenance Reserve (% of gross rent). Covers small repairs. Common 5–10% of gross rent annually (not vacancy-adjusted rent).
- CapEx Reserve (% of gross rent). For major items (roof, HVAC, etc). Also 5–10% typically.
- Detailed Mode: Enter actual annual amounts. Use if you have precise estimates:
- Maintenance (annual)
- Repairs/CapEx (annual)
- Other operating costs (annual)
- Utilities (gas, hydro, water monthly separately)
Why it matters: Operating expenses determine Net Operating Income (NOI) = EGI – Expenses. NOI is used for cap rate, DSCR, etc. Underestimating expenses (or skipping reserves) makes deals look artificially good.
Example (Simple Mode):
Gross rents $2,400/mo ($28,800/yr).
– Taxes: $3,600/yr, Insurance: $1,200/yr, Condo Fee: $0, Owner Utilities: $0.
– Mgmt: 5% of rent = $1,440/yr.
– Maint reserve 5% of gross = $1,440/yr, CapEx 5% = $1,440.
Operating expenses = $3,600+$1,200+$1,440+$1,440+$1,440 = $9,600/yr.
Thus NOI = $28,800×0.95 – $9,600.
Financing
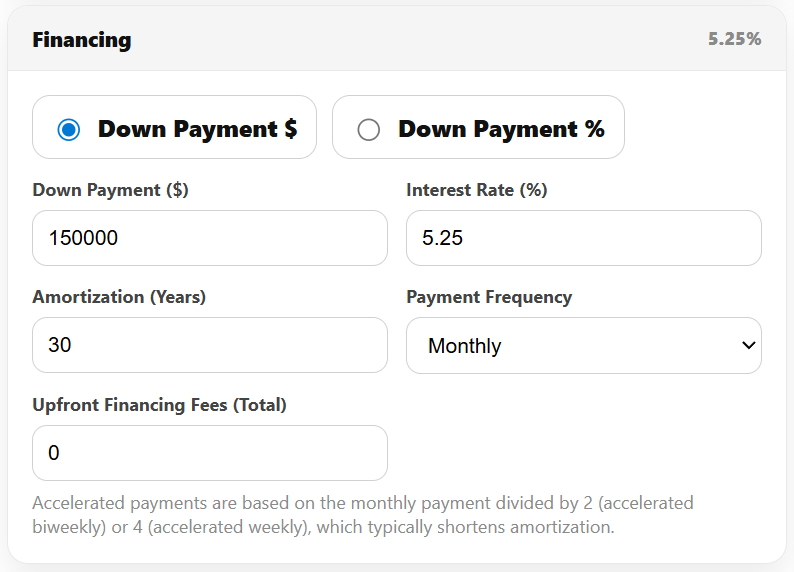
- Down Payment ($ or %): Cash put down. You can enter as dollar or percent of purchase price.
- Why it matters: Affects loan amount and cash invested. Higher down payment lowers leverage and debt service.
- Example: 20% on $500k = $100,000.
- Interest Rate (%): Annual mortgage rate. Use current lender quotes (e.g. 5.5%).
- Amortization (years): Mortgage amortization period (5–30 years).
- Payment Frequency: Monthly, Biweekly, Accelerated Biweekly, Weekly, Accelerated Weekly.
- Accelerated payments (biweekly/weekly) increase total annual payments (shorten effective amortization), which boosts principal paydown but slightly increases annual debt service.
- Upfront Financing Fees (total): Any lump-sum mortgage fees (appraisal, legal, points, mortgage insurance) you pay. Add to cash invested.
The tool computes Mortgage Payment & Annual Debt Service based on these. It then calculates Cash Flow = NOI – Debt Service.
Example: $400k mortgage, 5.0% rate, 25-year amort, monthly. The monthly payment is ~$2,330; annual debt service ~$27,960. If NOI is $20,000/yr, Cash Flow = –$7,960 (negative).
Closing Costs & Initial Cash Invested
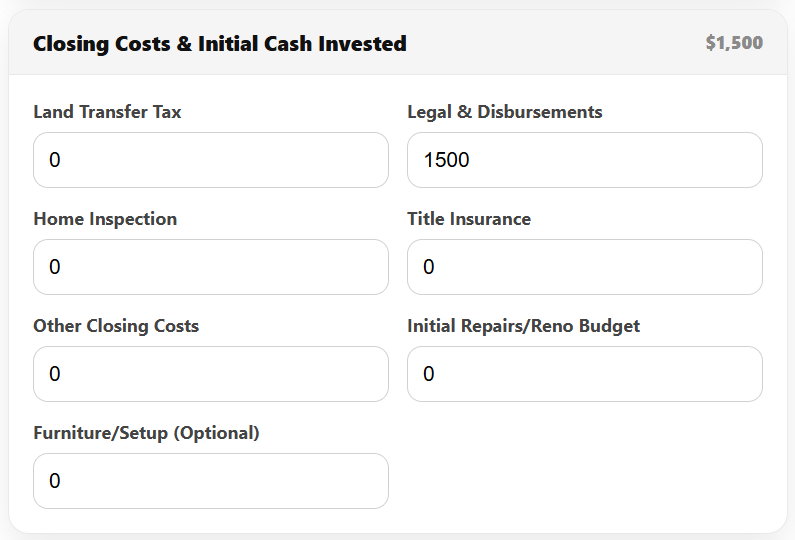
- Closing Costs: Enter all transaction costs:
- Land Transfer Tax, Legal & Disbursements, Inspection, Title Insurance, Other Closing Costs.
- Example: Legal $1,500, Inspection $300, others $0.
- Initial Renovation/Reno Budget: Any immediate repairs/renovations (paint, flooring, appliances, etc.).
- Furniture/Setup (if applicable): For furnished rentals or short-term setups.
The tool sums Initial Cash Invested = Down Payment + Closing Costs + Reno + Setup + Upfront Fees. This denominator is used for Cash-on-Cash Return (%) = (Annual Cash Flow) ÷ (Initial Cash Invested).
Why it matters: Underestimating these outlays (especially closing costs) inflates the cash-on-cash yield. Always include them for an accurate return.
Example: Purchase $500k, 20% DP ($100k), closing costs $5k, reno $5k. Initial cash = $100k+$5k+$5k = $110k.
Sensitivity & Stress Tests
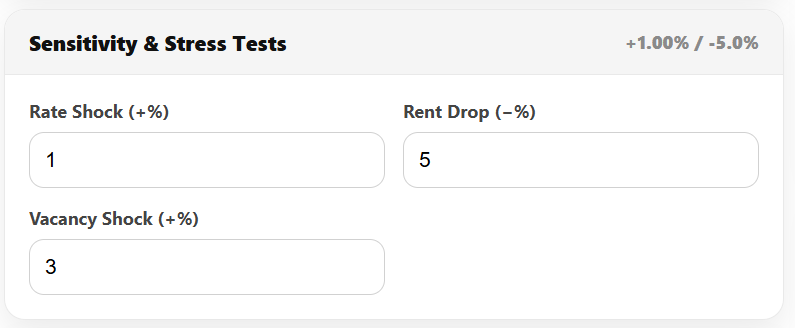
Enter stress test parameters:
- Rate Shock (+%): Simulate higher interest rate. E.g. +1.00% to model future rate increases.
- Rent Drop (–%): Simulate lower rent (e.g. –5%).
- Vacancy Shock (+%): Higher vacancy (e.g. +2%) for worst-case occupancy.
The tool recalculates Cash Flow, DSCR, and Break-even Rent under each scenario:
- Base: Your inputs as entered.
- Rate Shock: Rate = original + shock.
- Combined Shock: Rate up + Rent down + Vacancy up.
Review results carefully. Key questions: – Does cash flow turn negative under shock?
– Does DSCR drop near 1.0? (Near 1.0 is risky, as income barely covers debt).
– Does break-even rent exceed market rent? (Means any rent drop causes losses).
These tests expose vulnerability. For example, a deal with DSCR 1.3 at 5% may become 1.1 at 6%, and negative CF if rent drops 5%. That indicates a thin margin.
Projections (Hold / Value / Sale)
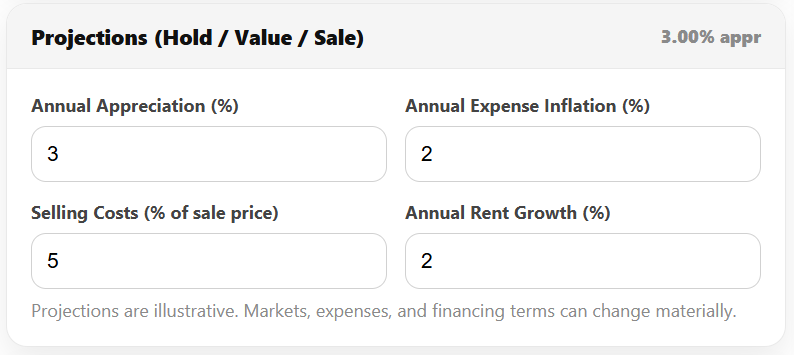
Switch Mode = Pro to enable projections.
- Annual Appreciation (%): Projected annual increase in property value.
- Example: 3.0% per year.
- Annual Expense Inflation (%): Growth in operating expenses (typically 1–3%).
- Rent Growth (%): (In Pro Mode) Growth in rent over time.
- Selling Costs (% of sale price): Realtor commissions and closing costs when selling.
- Example: 5%.
The tool then projects year-by-year: – Rent and NOI growth: based on rent growth and expense inflation.
– Mortgage balance decline: using amortization schedule.
– Annual cash flow: each year = NOI – Debt Service (constant loan payments).
– Projected sale price at end of hold = current price × (1+appreciation)^(years).
– Exit snapshot: remaining mortgage, selling costs, net sale proceeds, cumulative cash flow, total profit vs invested cash.
The Wealth Builder chart shows the composition of return for a given year (cash flow vs principal paydown vs appreciation) and outputs a percentage breakdown.
Example: A $500k property, 5-year hold, 3% appreciation, 2% expense inflation. In Year 5, maybe 50% of return comes from appreciation, 30% from cash flow, 20% from principal.
Refinance / Equity Extraction
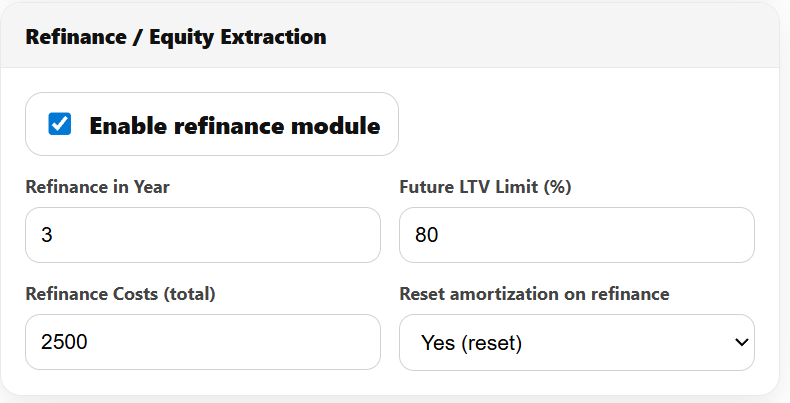
(Optional Pro mode module)
- Enable Refinance Module: Yes/No.
- Refinance Year: Year to refinance (within hold).
- Future LTV Limit (%): Maximum loan-to-value the lender might allow then (e.g. 80%).
- Refi Costs (total): Legal, appraisal, penalties.
- Reset Amortization: Option to restart amortization or continue remaining schedule.
If enabled, the tool projects: – Value at Refi Year = current price × (1+appreciation)^(year).
– Maximum Mortgage = Value × (LTV%).
– Mortgage Balance at Year X from amort schedule.
– Net Cash-Out = Max Mortgage – Balance – Refi Costs (if positive).
Why it matters: This models a BRRRR step or equity raise later. For example, after 5 years a $600k value at 80% LTV yields a $480k max mortgage. If balance is $300k and costs $5k, net cash-out ≈ $175k. This can be reinvested.
Assumptions & Disclaimers
This calculator is illustrative only. It assumes: – Rents, vacancies, and expenses behave linearly.
– Interest rate fixed (except shocks).
– Accurate user inputs (market-driven).
– Lender policies are standard (many lenders may not count all rent).
– No taxes or depreciation, unless using after-tax mode.
Important: Results depend on assumptions. Small changes can have big impacts. Always consult mortgage professionals and adjust assumptions conservatively. The tool is not a guarantee of financing or performance.
Investor Profiles (Conservative, Balanced, Aggressive)
The Investor Profile selector interprets the metrics with different risk tolerances. It doesn’t change the calculations, only the evaluation lens (labels, flags, grading).
- Conservative (Capital Preservation): Demands cushion in every area. Treats tight deals as riskier.
- Balanced (Growth + Stability – Default): Seeks a middle ground typical of many Canadian investors.
- Aggressive (Growth & Leverage): Accepts tighter margins if the upside (equity growth) is strong.
Each profile has target thresholds (good/watch/risk) for:
– Monthly Cash Flow (after expenses & debt)
– DSCR (Debt Service Coverage Ratio)
– Cash-on-Cash Return
– Break-even Rent Ratio (Break-even Rent ÷ Market Rent)
– Rate-Shock Resilience (whether CF stays positive under rate increase)
The tables below summarize the thresholds:
| Metric | Conservative (C) | Balanced (B) | Aggressive (A) |
| Cash Flow (mo) | ≥ $500 (good), $250–499 (watch), < $250 (risk) | ≥ $250, 0–249, < 0 | ≥ $0, –150––1, < –150 |
| DSCR | ≥ 1.25, 1.10–1.24, < 1.10 | ≥ 1.15, 1.05–1.14, < 1.05 | ≥ 1.05, 1.00–1.04, < 1.00 |
| Cash-on-Cash (%) | ≥ 6%, 4–5.99%, < 4% | ≥ 5%, 3–4.99%, < 3% | ≥ 4%, 2–3.99%, < 2% |
| Break-even Rent | ≤ 90% (of market), 91–95%, >95% | ≤ 95%, 96–100%, >100% | ≤ 100%, 101–105%, >105% |
| Rate-Shock CF | Must stay positive (risk if negative) | Prefer ≥0 (watch if slightly neg) | Can be slightly negative |
Example interpretation: If a deal shows $300/mo cash flow and DSCR 1.20:
– Conservative: CF is Watch (300<500), DSCR is Watch (1.20<1.25), alerts worry.
– Balanced: CF is Good (>=250), DSCR is Watch (1.20<1.15? Actually 1.20>=1.15 Good), so Good.
– Aggressive: CF is Good, DSCR Good (>=1.05). It looks strong.
Scoring for Deal Grade (A–D) uses these profile-adjusted bands. Each metric (above) earns 2 points for Strong, 1 for Acceptable, 0 for Risk. Max 10 points; 9–10 = A, 7–8 = B, 5–6 = C, ≤4 = D.
Worked Profile Examples
Consider a single scenario with inputs (price $500k, rent $3,000/mo, etc.) and see how each profile interprets it:
| Metric / Value | Result | Conservative Profile | Balanced Profile | Aggressive Profile |
| Monthly Cash Flow ($/mo) | +$2,933 | Good (>=500) | Good (>=250) | Good (>=0) |
| DSCR | 1.136 | Watch (1.136<1.25) | Watch (1.136<1.15) | Good (>=1.05) |
| Cash-on-Cash Return (%) | 1.94% | Risk (<4%) | Risk (<3%) | Watch (>=2%) |
| Break-even Rent Ratio (%) | 91.6% | Watch (91.6>90) | Good (<=95%) | Good (<=100%) |
| Cash Flow under Rate Shock | –$1,904/mo | Risk (neg CF) | Watch (small neg) | Acceptable (<=–150) |
| Total Score (of 10) | – | 2+1+0+1+0 = 4 (Grade D) | 2+1+0+2+1 = 6 (Grade C) | 2+2+1+2+2 = 9 (Grade A) |
Same deal, three lenses: Conservative profile sees multiple risks (low DSCR, break-even too high, negative shock CF) so grades D. Balanced sees some warnings (watch flags) and gets C. Aggressive is tolerant of low returns (though cash flow is thin) and scores A.
I provide three such example scenarios (numeric inputs and outputs in tables) later in this manual. Each example will show how the profile changes the interpretation.
Deal Scorecard and KPI Metrics
The Deal Scorecard displays the key metrics and their status under the selected profile:
- Monthly Cash Flow: (Annual Cash Flow ÷ 12). = NOI – Debt Service.
- NOI (Annual): Effective Gross Income – Operating Expenses (before debt).
- Cap Rate: NOI ÷ Purchase Price (×100). (A measure of value/yield.)
- DSCR: NOI ÷ Annual Debt Service. (Value <1 means negative cash flow.)
- Cash-on-Cash Return: (Annual Cash Flow ÷ Total Cash Invested)×100.
- Break-even Rent: Monthly rent needed (at given vacancy) to exactly cover expenses + debt. Equivalent Break-even Rent Ratio = (Break-even rent ÷ Market rent)×100.
Each tile shows the number and a status pill (Good/Watch/Risk) based on the profile thresholds.
Metric Definitions & Formulas
- NOI (Net Operating Income): The annual rental income after vacancy, minus operating costs. Formula:
- {EGI} = ({Monthly Rent} + {Other Income}) \times 12 \times (1 – {vacancy%})

- Monthly Cash Flow: (NOI − Annual Debt Service) ÷ 12. If negative, you’re losing money each month.
- Cap Rate: NOI ÷ Property Value. Roughly, the percentage yield of the property’s income. Typical “good” cap rates depend on market (e.g. 4–6% in stable markets).
- DSCR (Debt Service Coverage Ratio): NOI ÷ Annual Debt Service. A DSCR of 1.0 means income exactly covers debt. Lenders often require DSCR >1.1–1.25. Higher is safer.
- Cash-on-Cash Return: (Annual cash flow ÷ Cash invested)×100. A “quick yield” on cash put in. Investors often seek 4–8% depending on risk.
- Break-even Rent: The monthly rent level needed to exactly zero-out cash flow. It’s computed as:
- {Break-even Rent (monthly)} = {{Operating Expenses} + {Annual Debt Service}}{12 \times (1 – {vacancy%})} – {Other Monthly Income}
- The Break-even Rent Ratio = (Break-even rent ÷ market rent)×100. A ratio ≥100% means you’d need to rent at or above market to break even. Lower is better (more cushion). For example, 90–95% is often considered acceptable.
Status Interpretation
Each KPI tile shows Good, Watch, or Risk based on profile-adjusted thresholds (see Profile section). For example, a Cash Flow of $300/mo is Good for Balanced (≥$250), but only Watch for Conservative (target ≥$500). A DSCR of 1.1 is Watch for Conservative (needs ≥1.25) but Good for Balanced (≥1.15).
Overall Grade Calculation
The deal grade (A–D) is computed as described: each of five categories (Cash Flow, DSCR, Cash-on-Cash, Break-even Rent, Rate-Shock CF) is scored 0–2. Total points 0–10; then mapped: A=9–10, B=7–8, C=5–6, D≤4. This quick “grade” lets you compare deals at a glance.
Threshold Summary Table: (for Balanced profile as example)
| Metric | Strong (2pt) | Acceptable (1pt) | Risk (0pt) |
| Cash Flow (mo) | ≥ $250 | $0 to $249 | < $0 |
| DSCR | ≥ 1.15 | 1.05 to 1.14 | < 1.05 |
| Cash-on-Cash (%) | ≥ 5% | 3% to 4.99% | < 3% |
| Break-even Rent % | ≤ 95% | 96% to 100% | > 100% |
| Rate-Shock CF | ≥ $0 | $–150 to –$1 | < –$150 |
(Conservative and Aggressive use tighter/looser bands as earlier tables.)
Example Scenarios
Below are three example deals with full inputs and outputs. Each example shows KPI results and grades under all three profiles. (All amounts in CAD.)
Example 1: Standard Condo (Balanced Leaning)
- Purchase Price: $500,000
- Rent: $3,000/month, Other Income $0, Vacancy 3%
- Expenses: Taxes $3,000, Insurance $1,200, Mgmt 5%, Maint 5%, CapEx 5%, No condo fee, owner utilities $0.
- Financing: 30% down ($150k), 3.75% rate, 25-year amort, monthly payment.
- Closing: Legal $1,500; no LTT; initial reno $0.
- Stress: +1% rate shock, –5% rent, +2% vacancy.
Computed KPIs: EGI ~$34,920; Expenses ~$10,394; NOI $24,526; Annual Debt Service ~$21,594; Cash Flow +$2,933/yr (+$244/mo); Cap Rate 4.90%; DSCR 1.14; Cash-on-Cash 1.94%; Break-even Rent $2,748 (≈91.6%).
| Metric | Value | Conservative | Balanced | Aggressive |
| Monthly Cash Flow | +$244 | Good (2) | Good (2) | Good (2) |
| DSCR | 1.14 | Watch (1) | Watch (1) | Good (2) |
| Cash-on-Cash | 1.94% | Risk (0) | Risk (0) | Watch (1) |
| Break-even Rent Ratio | 91.6% | Watch (1) | Good (2) | Good (2) |
| Rate-Shock Cash Flow | –$1,904/mo | Risk (0) | Watch (1) | Acceptable (1) |
| Total Score/Grade | – | 4 – D | 6 – C | 8 – B |
Interpretation: Balanced investors see a C (6/10): cash flow and DSCR are OK, but returns are low. Conservative sees too much risk (D). Aggressive is comfortable (B).
Example 2: Conservative Villa (High Down Payment)
- Purchase Price: $500,000
- Rent: $3,000/month, Vacancy 3%
- Expenses: Taxes $3,000, Insurance $1,200, Mgmt 5%, Maint/CapEx 5% each.
- Financing: 40% down ($200k), 3.00% rate, 25-year amort.
- Closing: Legal $1,500, Renos $0.
KPIs: EGI $34,920; Expenses $10,394; NOI $24,526; ADS $17,072; Cash Flow +$7,455/yr ($621/mo); Cap Rate 4.91%; DSCR 1.44; Cash-on-Cash 3.70%; Break-even Rent $2,360 (78.7%).
| Metric | Value | Conservative | Balanced | Aggressive |
| Monthly Cash Flow | +$621 | Good (2) | Good (2) | Good (2) |
| DSCR | 1.44 | Good (2) | Good (2) | Good (2) |
| Cash-on-Cash | 3.70% | Risk (0) | Risk (0) | Watch (1) |
| Break-even Rent Ratio | 78.7% | Good (2) | Good (2) | Good (2) |
| Rate-Shock Cash Flow | +$3,517/mo | Good (2) | Good (2) | Good (2) |
| Total Score/Grade | – | 8 – B | 8 – B | 9 – A |
Interpretation: High cushion yields an overall B for Conservative & Balanced, A for Aggressive. Conservative values the ample cash flow and DSCR; all see break-even comfort.
Example 3: Tight Income Property (Low Cash Flow)
- Purchase Price: $400,000
- Rent: $2,400/month, Vacancy 3%
- Expenses: Taxes $4,000, Insurance $1,800, Mgmt 8%, Maint/CapEx 8%.
- Financing: 25% down ($100k), 6.0% rate, 20-year amort.
- Closing: Legal $2,000, Inspection $300, Reno $5,000.
KPIs: EGI $27,888; Expenses $17,520; NOI $10,368; ADS $32,853; Cash Flow –$22,485/yr (–$1,874/mo); Cap Rate 2.59%; DSCR 0.32; Cash-on-Cash –17.64%; Break-even Rent $5,954 (≈248%).
| Metric | Value | Conservative | Balanced | Aggressive |
| Monthly Cash Flow | –$1,874 | Risk (0) | Risk (0) | Risk (0) |
| DSCR | 0.32 | Risk (0) | Risk (0) | Risk (0) |
| Cash-on-Cash | –17.6% | Risk (0) | Risk (0) | Risk (0) |
| Break-even Rent Ratio | 248% | Risk (0) | Risk (0) | Risk (0) |
| Rate-Shock Cash Flow | –$3,781/mo | Risk (0) | Risk (0) | Risk (0) |
| Total Score/Grade | – | 0 – D | 0 – D | 0 – D |
Interpretation: This deal fails under all profiles (grade D). It has negative cash flow and DSCR well below 1. Even Aggressive finds it unacceptable.
These examples illustrate how profile interpretation affects perception. A deal with modest positives (Example 1) might be Watch or OK under Balanced but Risky to Conservative. Conversely, Example 3 is universally rejected.
Workflows for Common Goals
Quick Screening (Initial Feasibility)
- Enter Deal Basics, Rent & Income, Expenses, Financing for current conditions.
- Focus on Cash Flow and DSCR (ignore projections).
- Run Stress Tests (especially Rate Shock).
- If Cash Flow ≥ $0 (or profile target) and DSCR ≥ ~1.1 (for Balanced) and CF holds under shock, the deal may work. Otherwise, likely too tight.
- Adjust inputs (rent or down payment) to see sensitivities.
- If quick health looks good, switch to Pro Mode for deeper analysis.
Purchase Underwriting
- Gather accurate data: taxes, condo fees, quotes on renovations.
- Use Simple or Detailed mode depending on data: simple is faster and safer (always include reserves).
- Choose a conservative vacancy (e.g. 5%).
- Input realistic financing (include any mortgage insurance).
- Check the Deal Scorecard: Aim for ≥B grade under Balanced profile. Look at Risk Flags and grade.
- Use Profile selector: if you (or your client) are cautious, switch to Conservative to see worst-case flags.
- Use PDF Export for documentation, including scenario A/B if comparing multiple offers.
Refinance / Equity Extraction
- Switch to Refinance mode and input existing mortgage and current value.
- In Pro Mode, enable refinance year and LTV limit.
- Ensure DSCR ≥ lender threshold after refinance (often new DSCR must be acceptable).
- Review net cash-out and total returns. If planning a BRRRR, compare the cash-out vs. cash invested to ensure positive leverage.
BRRRR (Buy, Rehab, Rent, Refinance, Repeat)
- In Deal Basics, treat as Purchase. Enter rehab costs under Closing Costs (Initial Reno).
- Rent & Income based on stabilized rent after rehab.
- Financing as purchase loan; include rehab loan or cash.
- Rebalance in Refinance: In Pro Mode, set Refi Year (often 1 or 2) and assume 80%+ LTV (subject to CMHC rules).
- Check if refinance cash-out exceeds original equity and improves cash flow (reuse funds for next property).
Workflow Diagram
gantt
    title Typical Deal Analysis Timeline
    section Quick Analysis
      Input basic data: done, 2026-02-01, 1d
      Check cash flow & DSCR: done, after Input, 1d
      Run stress tests: done, 1d
    section Deep Underwriting
      Switch to Pro Mode: active, after Quick Analysis, 0.5d
      Enter projections/exit: 1d
      Adjust strategy (down payment/rate): 0.5d
      Final review & PDF export: 0.5d
Practical Tips & Common Mistakes
- Include Vacancies and Reserves: Always assume some vacancy and set aside maintenance/CapEx. Leaving these at 0% gives a false “cream-of-crop” view.
- Don’t Compare Apples-to-Oranges: Use consistent assumptions (vacancy, profiles) when comparing two listings.
- Beware of Low Cash Flow: A “slam-dunk” cap rate may still have thin cash flow if expenses or financing are high.
- Use PDF Summary: The downloadable PDF is great for sharing with partners, lenders, or clients. It captures all inputs and outputs cleanly.
- Adjust Profile to Client: If your client is risk-averse, review deals under Conservative profile and discuss safeguards (higher down payment, shorter amort, etc.).
- Lender Income Rules: Some lenders only count part of rental income (e.g. 50% of extra unit rent). The tool assumes you get full rent in cash flow. Factor this manually if needed.
- Refinance Assumptions: Future refinance depends on lender and housing market; use it for planning, not a promise.
Common pitfall: Entering purchase price instead of current value on refinance deals. This can double-count price and distort LTV. The tool hides the wrong fields based on context – ensure only relevant fields are shown.
Frequently Asked Questions
Q: Should I use Simple or Detailed expense mode?
A: For quick screening, Simple mode is easier (uses % reserves). Detailed mode is for when you have firm numbers (e.g. tax bills vs. estimated reserves). Always double-check no expense (like vacancy or utilities) is left at 0 unless true.
Q: What vacancy rate is safe?
A: No magic number; 3% is optimistic but common in urban markets. 5% is more conservative, 10% is extreme. Consider market turnover and tenant reliability.
Q: What is a “good” DSCR?
A: Industry: For insured loans (CMHC, etc.) ~1.1–1.25; for conventional deals often >1.25–1.40. In my tool, Balanced expects ≥1.15 (good), Conservative ≥1.25.
Q: Why is break-even rent useful?
A: It tells you how low rents (or how high expenses) can go before you lose money. A break-even above market rent is a warning: any vacancy or cost spike will kill cash flow.
Q: Can profiles be renamed?
A: The panel calls them Conservative/Balanced/Aggressive. If you prefer other terms (e.g. “Cushion/Standard/Growth”), adjust names but keep logic. Profiles reflect risk tolerance, not physical property type.
Q: Are projections reliable?
A: Projections use your appreciation/inflation inputs. They illustrate “if X happens.” They are not guarantees. Always check sensitivity by changing appreciation or selling costs.
Q: How often should I update this?
A: As often as assumptions change. Rates, taxes, or rents can shift constantly. Re-run scenarios whenever you reconsider a deal.